Released on 19 March 2026: fewer marriages, later marriages, and a more differentiated formal union system.
Prepared from Official Statistics South Africa data contained in Marriages and Divorces, 2024.
Source note This article is based on the P0307 release published under embargo for 19 March 2026. The release records marriages and unions registered during 2024 and should be read as an administrative snapshot of formal union registration.
The 2024 release shows that South Africa is still marrying, but is doing so less often, later in life, and through increasingly differentiated legal forms. Civil marriages remain dominant but are declining; customary marriages fell sharply in the latest year; and civil unions remain small but highly concentrated in Gauteng and the Western Cape.
Article
Statistics South Africa’s Marriages and Divorces, 2024 release, published on 19 March 2026, offers a revealing picture of how formal union formation is changing in South Africa. The release is based on marriages and unions registered in 2024 through the Department of Home Affairs system, and not all of those unions were necessarily solemnised for the first time in that same year. The report also states that this edition excludes Muslim marriages, although those are collected and may be included in future reporting. That matters, because the publication is a picture of formally registered unions in the state system, not a complete census of all intimate partnerships in the country.
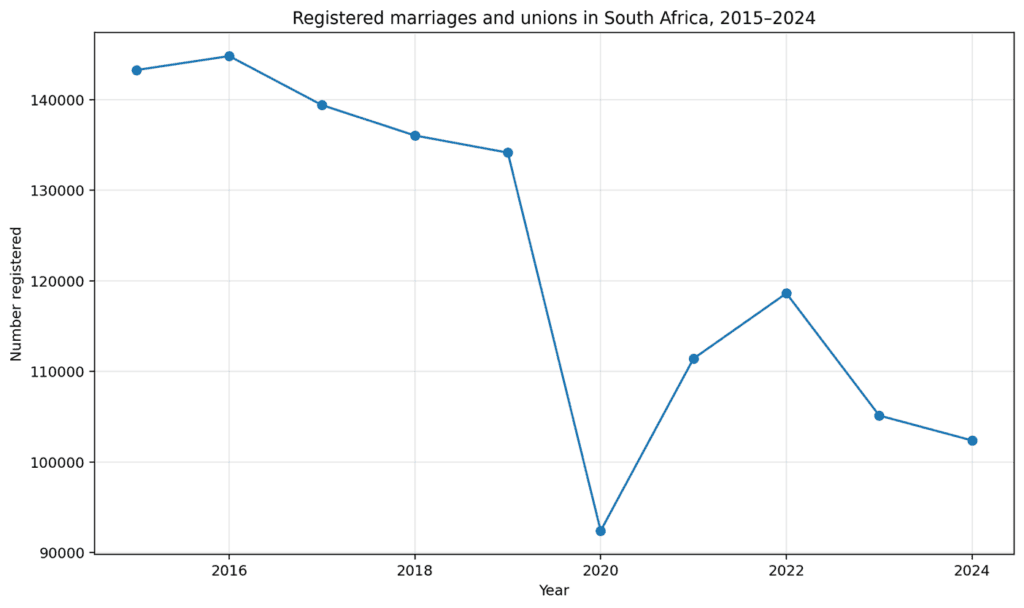
The headline number is that 102 373 marriages and unions were registered in 2024. That was down 2,6% from 105 123 in 2023 and down 28,5% from 143 279 in 2015. The crude marriage rate stood at 1,6 per 1 000 population in 2024, compared with an average of 2,4 per 1 000 between 2015 and 2019. South Africa is therefore not merely experiencing a temporary fluctuation. It is functioning at a materially lower marriage-registration level than it did a decade ago and at a lower level than in the pre-pandemic period.

Civil marriages remain dominant, but the longer trend is downward
That overall decline is driven mainly by civil marriages, because civil marriages remain by far the dominant category in the formal system. In 2024, 97 510 civil marriages were registered, compared with 99 289 in 2023, a decline of 1,8%. The longer trend is even more telling. Civil marriages stood at 138 627 in 2015, rose slightly to 139 512 in 2016, and then declined over time, hitting a low of 89 338 in 2020 before recovering to 111 784 in 2022 and then dropping again in 2023 and 2024. The post-lockdown rebound was real, but it was incomplete and did not restore marriage registrations to their earlier level.
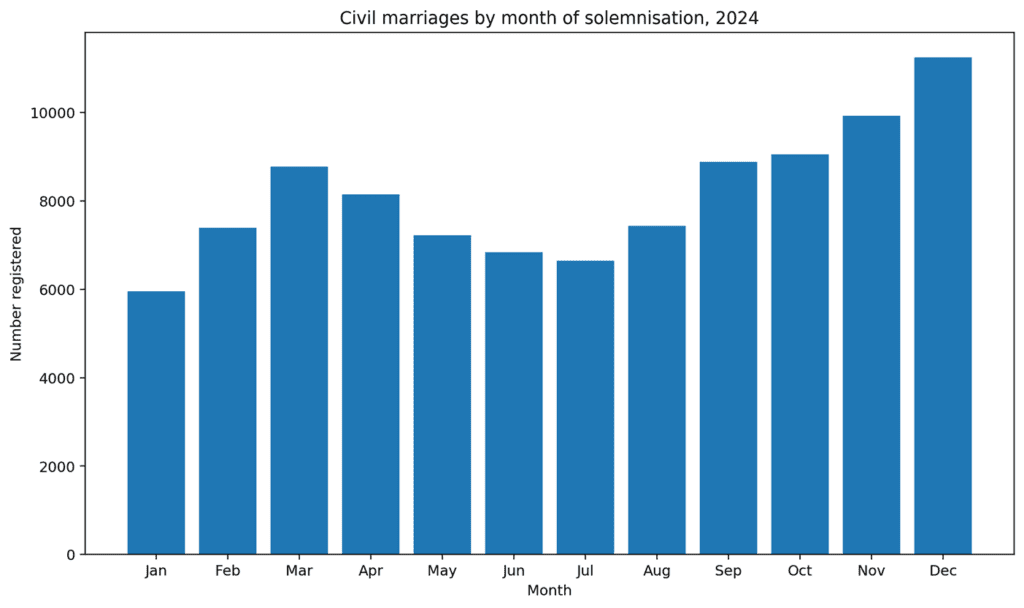
The seasonal pattern, however, remains strikingly stable. The warmer months, beginning in September and peaking in December, remain the most popular period for solemnising civil marriages. In 2024, December recorded the highest number of civil marriages at 11 249, while January recorded the lowest at 5 950. That continuity is significant. It shows that although fewer couples are entering formal marriage, those who do still tend to marry within a very recognisable seasonal pattern shaped by climate, holidays and ceremony planning.
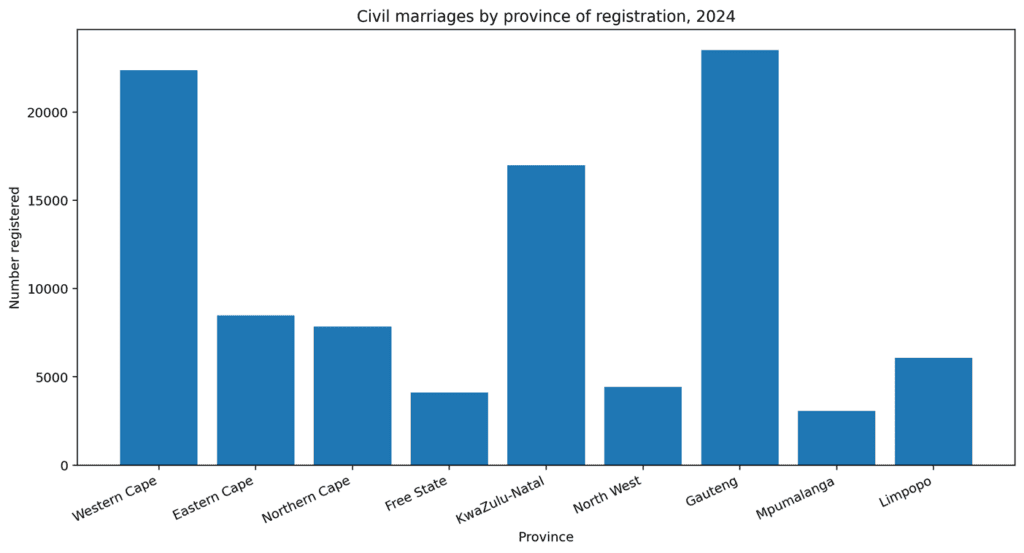
The way marriages are solemnised also says something important about the institutional structure of formal marriage in South Africa. Of the 97 510 civil marriages registered in 2024, 54 444, or 55,8%, were solemnised by Department of Home Affairs marriage officers, while 31 529, or 32,3%, were solemnised by religious officers. Gauteng recorded the highest number of civil marriages at 23 509, followed by the Western Cape at 22 382, while Mpumalanga recorded the lowest at 3 080. The Western Cape had the highest proportion of religious solemnisation, at 52,3%, while Limpopo had the highest proportion solemnised by DHA officers, at 84,3%. So the formal marriage system remains both state-centred and provincially uneven.
The age profile of civil marriage reinforces another long-term shift: South Africans are marrying later. In 2024, the median age at civil marriage was 39 for bridegrooms and 35 for brides. For first marriages specifically, the median age rose from 35 to 36 for never-married men between 2020 and 2024, and from 32 to 33 for never-married women. Men also remained older than their spouses in most civil marriages. In 75,0% of civil marriages, the bridegroom was older than the bride. At the same time, first marriages still dominated the system: 77 463 bridegrooms, or 79,4%, and 82 431 brides, or 84,5%, were marrying for the first time. That is a crucial point. The decline in marriage registrations cannot be explained simply by a weaker remarriage market; the first-marriage pipeline itself is softer than before.

Customary marriages show the sharpest recent contraction
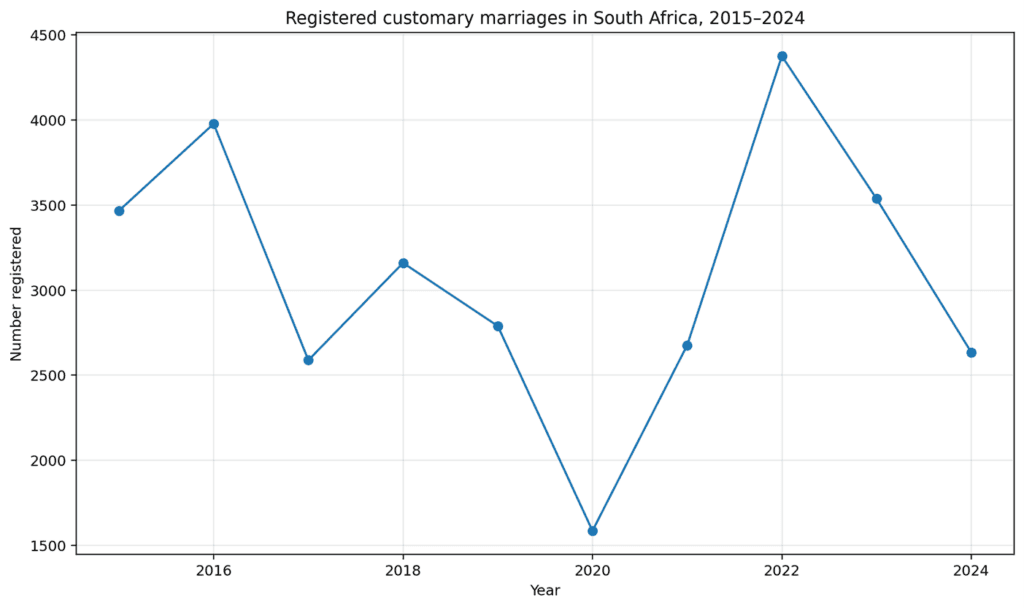
Customary marriages tell a sharper and more volatile story. In 2024, 2 634 customary marriages were registered, down from 3 537 in 2023, which amounted to a 25,5% decline. Over the 2015-2024 period, customary marriages fluctuated rather than following the steadier downward pattern seen in civil marriages. The high point was 4 376 in 2022 and the low point 1 585 in 2020. Provincial concentration remains strong. Limpopo recorded 718 customary marriages in 2024 and KwaZulu-Natal 704, and these two provinces together accounted for over half of all customary marriages registered in the year. That makes customary marriages both regionally concentrated and more volatile from year to year than civil marriages.
The demographic pattern of customary marriages is also distinct. Bridegrooms were generally six to seven years older than brides over the 2020-2024 period. In 2024, the median age was 35 for bridegrooms and 29 for brides. The largest age group for bridegrooms was 30-34, while for brides it was 25-29. Most notably, 84,7% of customary marriages involved a bridegroom older than the bride. The data also record that marriages involving persons under 18 were much more likely to involve brides than bridegrooms, with 160 brides under 18 compared with 15 bridegrooms. That makes customary marriages demographically different from the civil-marriage profile, especially on age gradient and youthful female entry.

Civil unions remain small, but their geography is highly concentrated
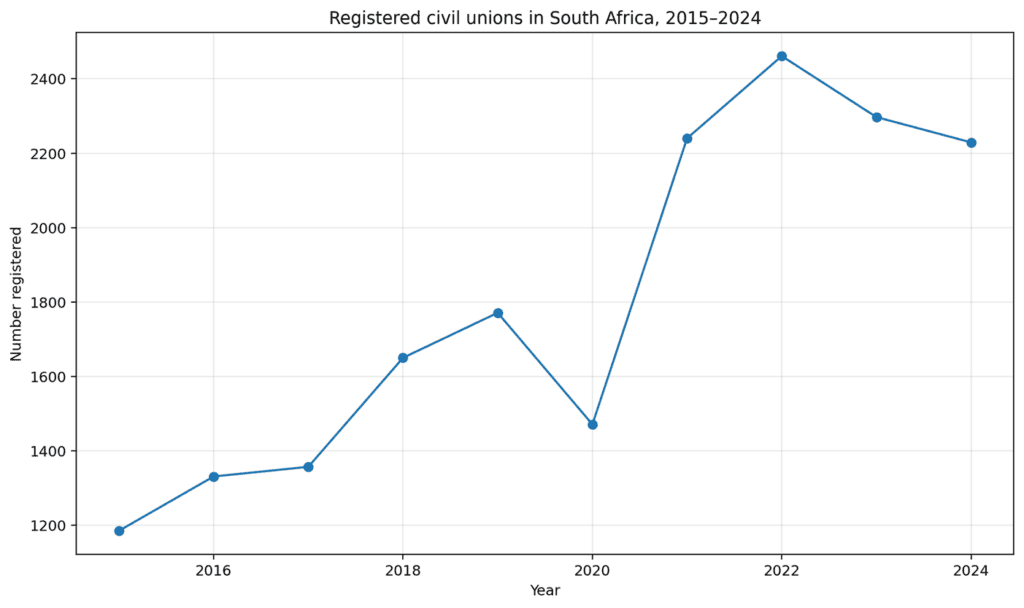
Civil unions present a third and different pattern. In 2024, 2 229 civil unions were registered, down 3,0% from 2 297 in 2023. Over the longer period, however, civil unions had generally increased from 2015 to 2022, aside from the pandemic dip in 2020, before softening in 2023 and 2024. Their geographic concentration is especially pronounced. Gauteng recorded 943 civil unions in 2024 and the Western Cape 751, meaning that 76,0% of all civil unions were registered in those two provinces alone. That marks civil unions out as both smaller in number and more regionally concentrated than civil marriages.
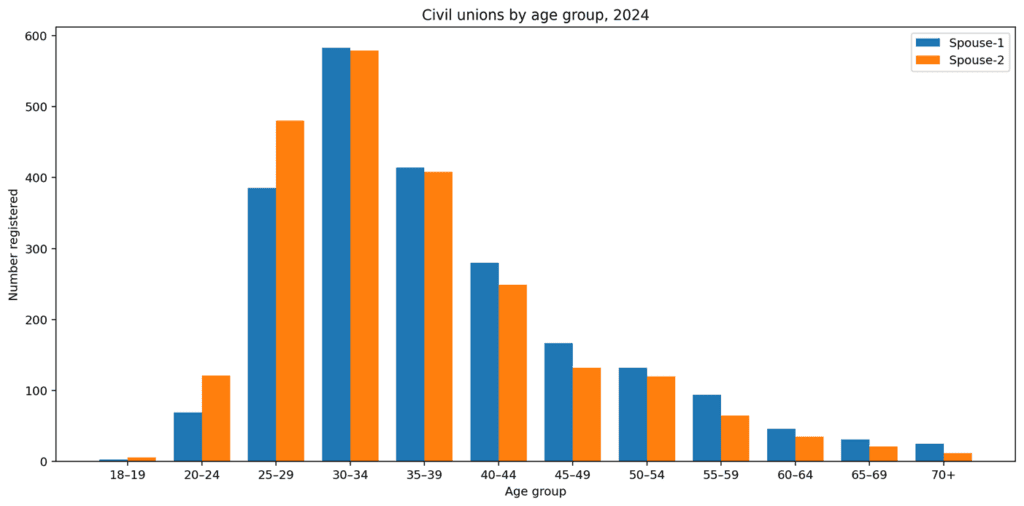
Their age profile is also more balanced than that of customary marriages. In 2024, the largest age group for both spouse-1 and spouse-2 was 30-34, with 583 spouse-1 registrations and 579 spouse-2 registrations. The median ages were 35 for spouse-1 and 34 for spouse-2 in 2024. The data further record that 57,6% of spouse-1 partners were older than spouse-2, while 31,2% were younger and 11,1% were of the same age. Compared with customary marriages, the civil-union profile therefore shows a narrower age gap and a more even age structure between partners.

What changed from the previous period, and why it matters
There is an important limitation in the data, and it should discipline how the figures are interpreted. For customary marriages and civil unions, the Department of Home Affairs data do not allow a distinction between first-time partners and persons who had previously married. Some conclusions can therefore be drawn robustly about volume, geography and age, but not about the prior marital histories of partners in those two categories.
Taken together, the 2024 marriage statistics point to a South Africa that is still marrying, but doing so less often, later in life, and through forms of union recognition that are increasingly differentiated by province and demographic profile. Civil marriages remain dominant but are declining. Customary marriages are fluctuating and fell sharply in the latest year. Civil unions remain comparatively small, but their long-term arc is more stable and their geography more concentrated.
The most important comparison with the previous period is therefore this: the post-pandemic recovery in marriage registrations has lost momentum, and the country appears to be settling into a lower-registration era than the one that prevailed in the mid-2010s. South Africa is still marrying, but marrying less, marrying later, and formalising unions through different legal channels depending on province and marriage type.
Source
Statistics South Africa, P0307: Marriages and Divorces, 2024, released on 19 March 2026.
Graphs in this document were prepared from the published numerical tables in the official release.
Written by Bertus Preller, a Family Law and Divorce Law attorney and Mediator at Maurice Phillips Wisenberg in Cape Town and founder of iDivorce and iANC. A blog, managed by SplashLaw, for more information on Family Law read more here. For free and useful Family Law tech applications visit Maintenance Calculator and Accrual Calculator.
DOWNLOAD THE STATISTICS HERE: